I’m attending the https://linux.conf.au/ conference online this weekend, which is always a good opportunity for some sideline hacking.
I found something boneheaded doing that today.
There have been a few times while inventing the OpenHMD Rift driver where I’ve noticed something strange and followed the thread until it made sense. Sometimes that leads to improvements in the driver, sometimes not.
In this case, I wanted to generate a graph of how long the computer vision processing takes – from the moment each camera frame is captured until poses are generated for each device.
To do that, I have a some logging branches that output JSON events to log files and I write scripts to process those. I used that data and produced:
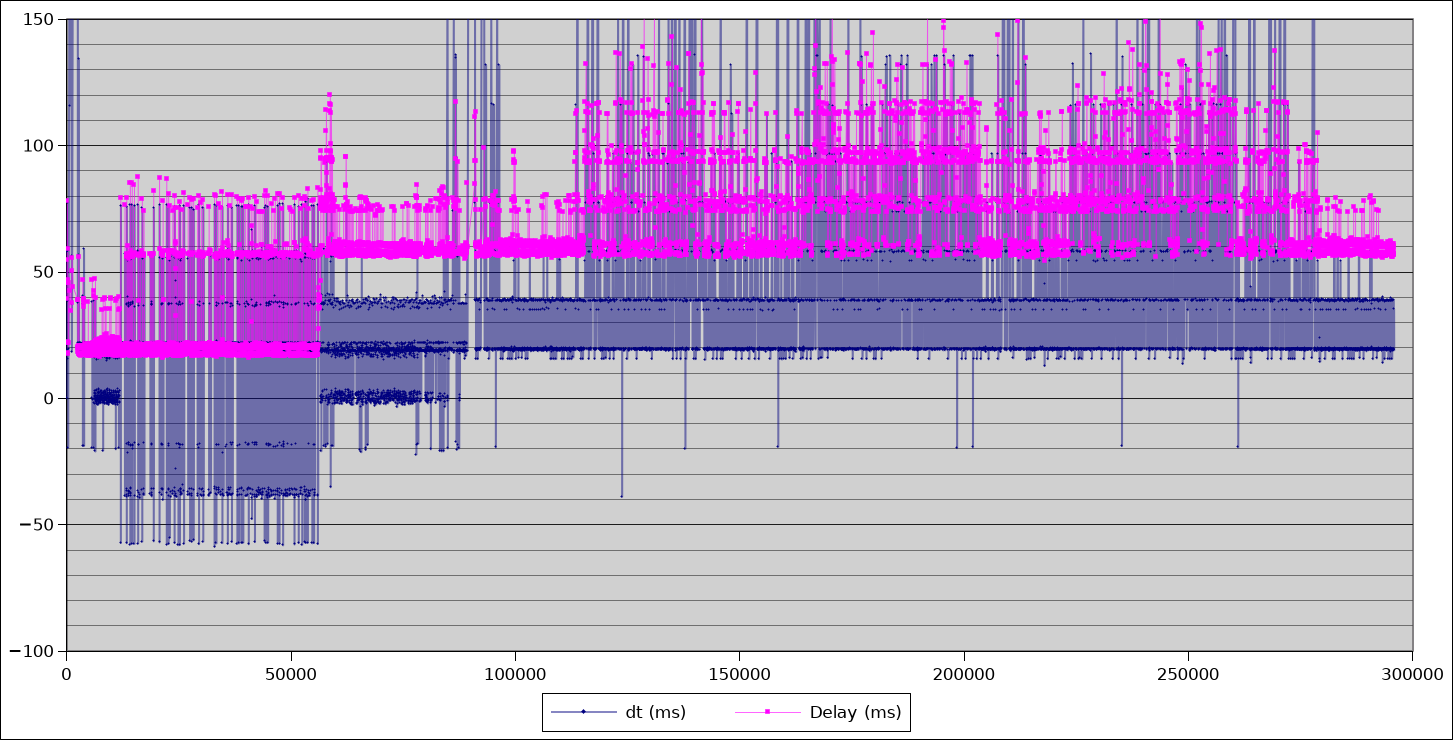
dt = interpose spacing, delay = frame to pose latency
Two things caught my eye in this graph. The first is the way the baseline latency (pink lines) increases from ~20ms to ~58ms. The 2nd is the quantisation effect, where pose latencies are clearly moving in discrete steps.
Neither of those should be happening.
Camera frames are being captured from the CV1 sensors every 19.2ms, and it takes that 17-18ms for them to be delivered across the USB. Depending on how many IR sources the cameras can see, figuring out the device poses can take a different amount of time, but the baseline should always hover around 17-18ms because the fast “device tracking locked” case take as little as 1ms.
Did you see me mention 19.2ms as the interframe period? Guess what the spacing on those quantisation levels are in the graph? I recognised it as implying that something in the processing is tied to frame timing when it should not be.
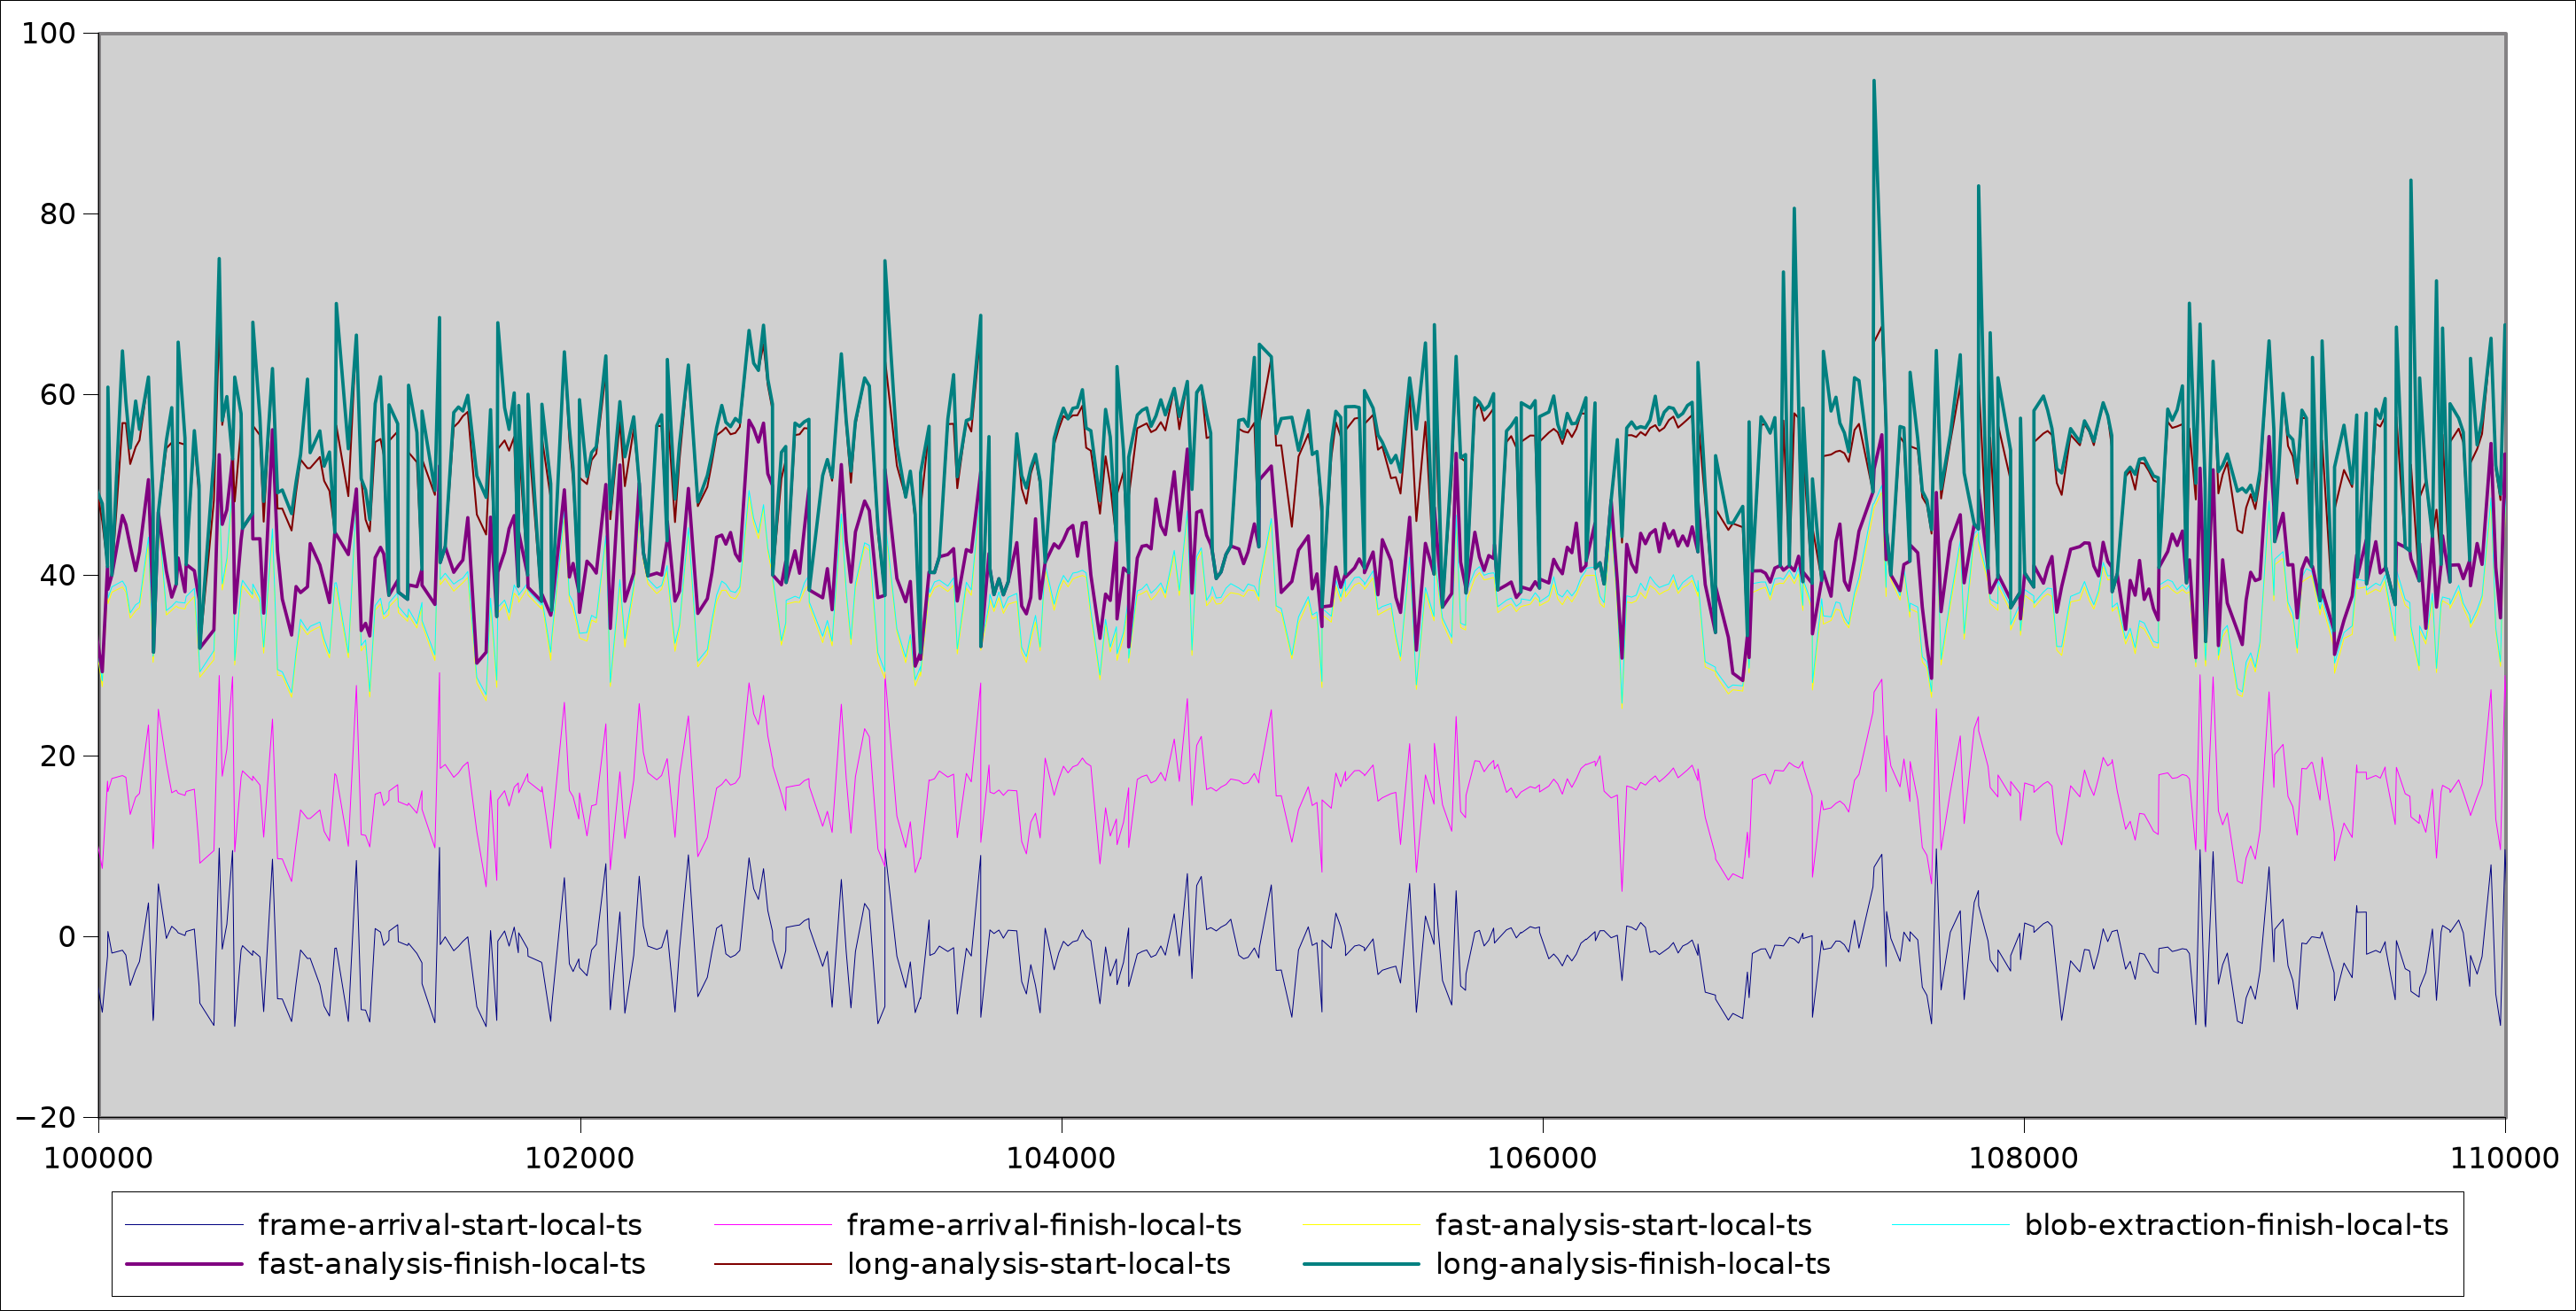
This 2nd graph helped me pinpoint what exactly was going on. This graph is cut from the part of the session where the latency has jumped up. What it shows is a ~1 frame delay between when the frame is received (frame-arrival-finish-local-ts) before the initial analysis even starts!
That could imply that the analysis thread is just busy processing the previous frame and doesn’t get start working on the new one yet – but the graph says that fast analysis is typically done in 1-10ms at most. It should rarely be busy when the next frame arrives.
This is where I found the bone headed code – a rookie mistake I wrote when putting in place the image analysis threads early on in the driver development and never noticed.
There are 3 threads involved:
- USB service thread, reading video frame packets and assembling pixels in framebuffers
- Fast analysis thread, that checks tracking lock is still acquired
- Long analysis thread, which does brute-force pose searching to reacquire / match unknown IR sources to device LEDs
These 3 threads communicate using frame worker queues passing frames between each other. Each analysis thread does this pseudocode:
while driver_running:
    Pop a frame from the queue
    Process the frame
    Sleep for new frame notification
The problem is in the 3rd line. If the driver is ever still processing the frame in line 2 when a new frame arrives – say because the computer got really busy – the thread sleeps anyway and won’t wake up until the next frame arrives. At that point, there’ll be 2 frames in the queue, but it only still processes one – so the analysis gains a 1 frame latency from that point on. If it happens a second time, it gets later by another frame! Any further and it starts reclaiming frames from the queues to keep the video capture thread fed – but it only reclaims one frame at a time, so the latency remains!
The fix is simple:
while driver_running:
   Pop a frame
   Process the frame
   if queue_is_empty():
     sleep for new frame notification
Doing that for both the fast and long analysis threads changed the profile of the pose latency graph completely.
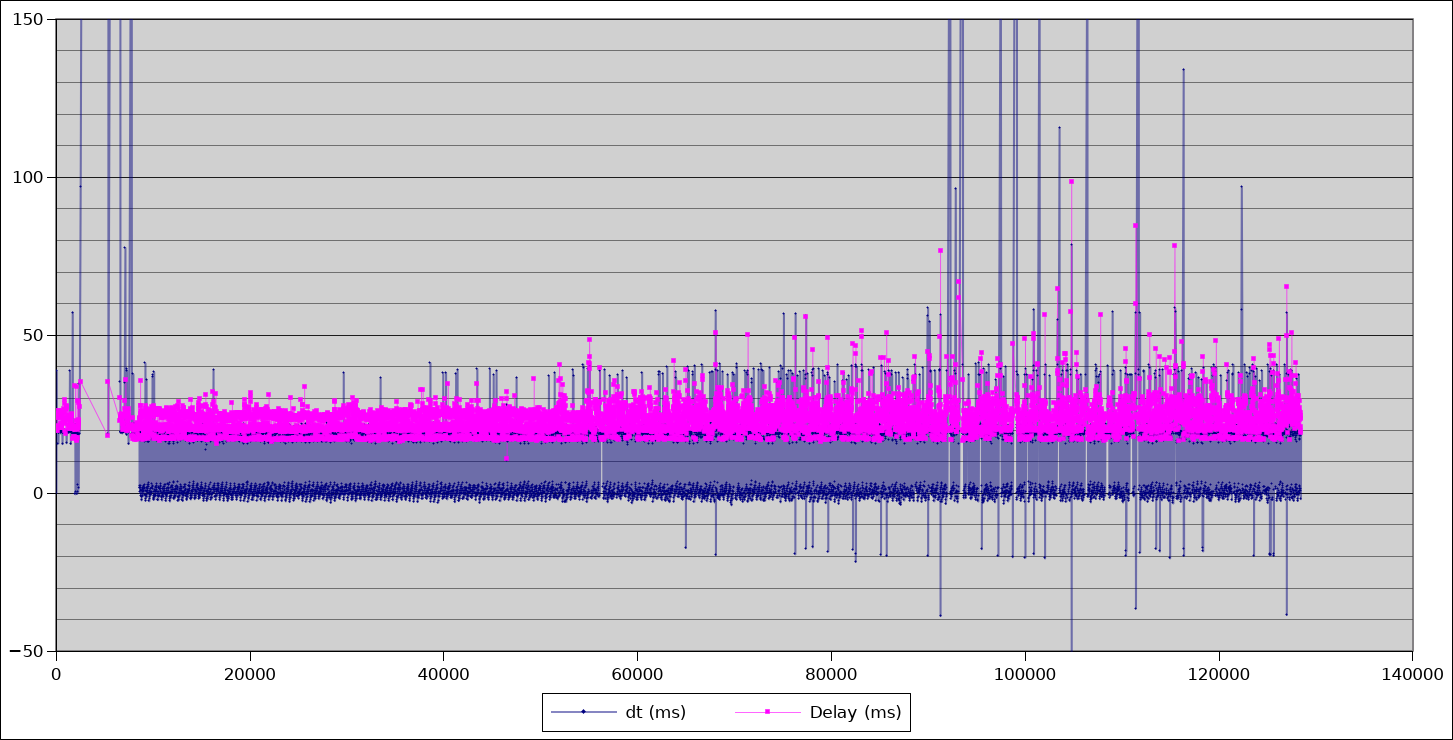
This is a massive win! To be clear, this has been causing problems in the driver for at least 18 months but was never obvious from the logs alone. A single good graph is worth a thousand logs.
What does this mean in practice?
The way the fusion filter I’ve built works, in between pose updates from the cameras, the position and orientation of each device are predicted / updated using the accelerometer and gyro readings. Particularly for position, using the IMU for prediction drifts fairly quickly. The longer the driver spends ‘coasting’ on the IMU, the less accurate the position tracking is. So, the sooner the driver can get a correction from the camera to the fusion filter the less drift we’ll get – especially under fast motion. Particularly for the hand controllers that get waved around.
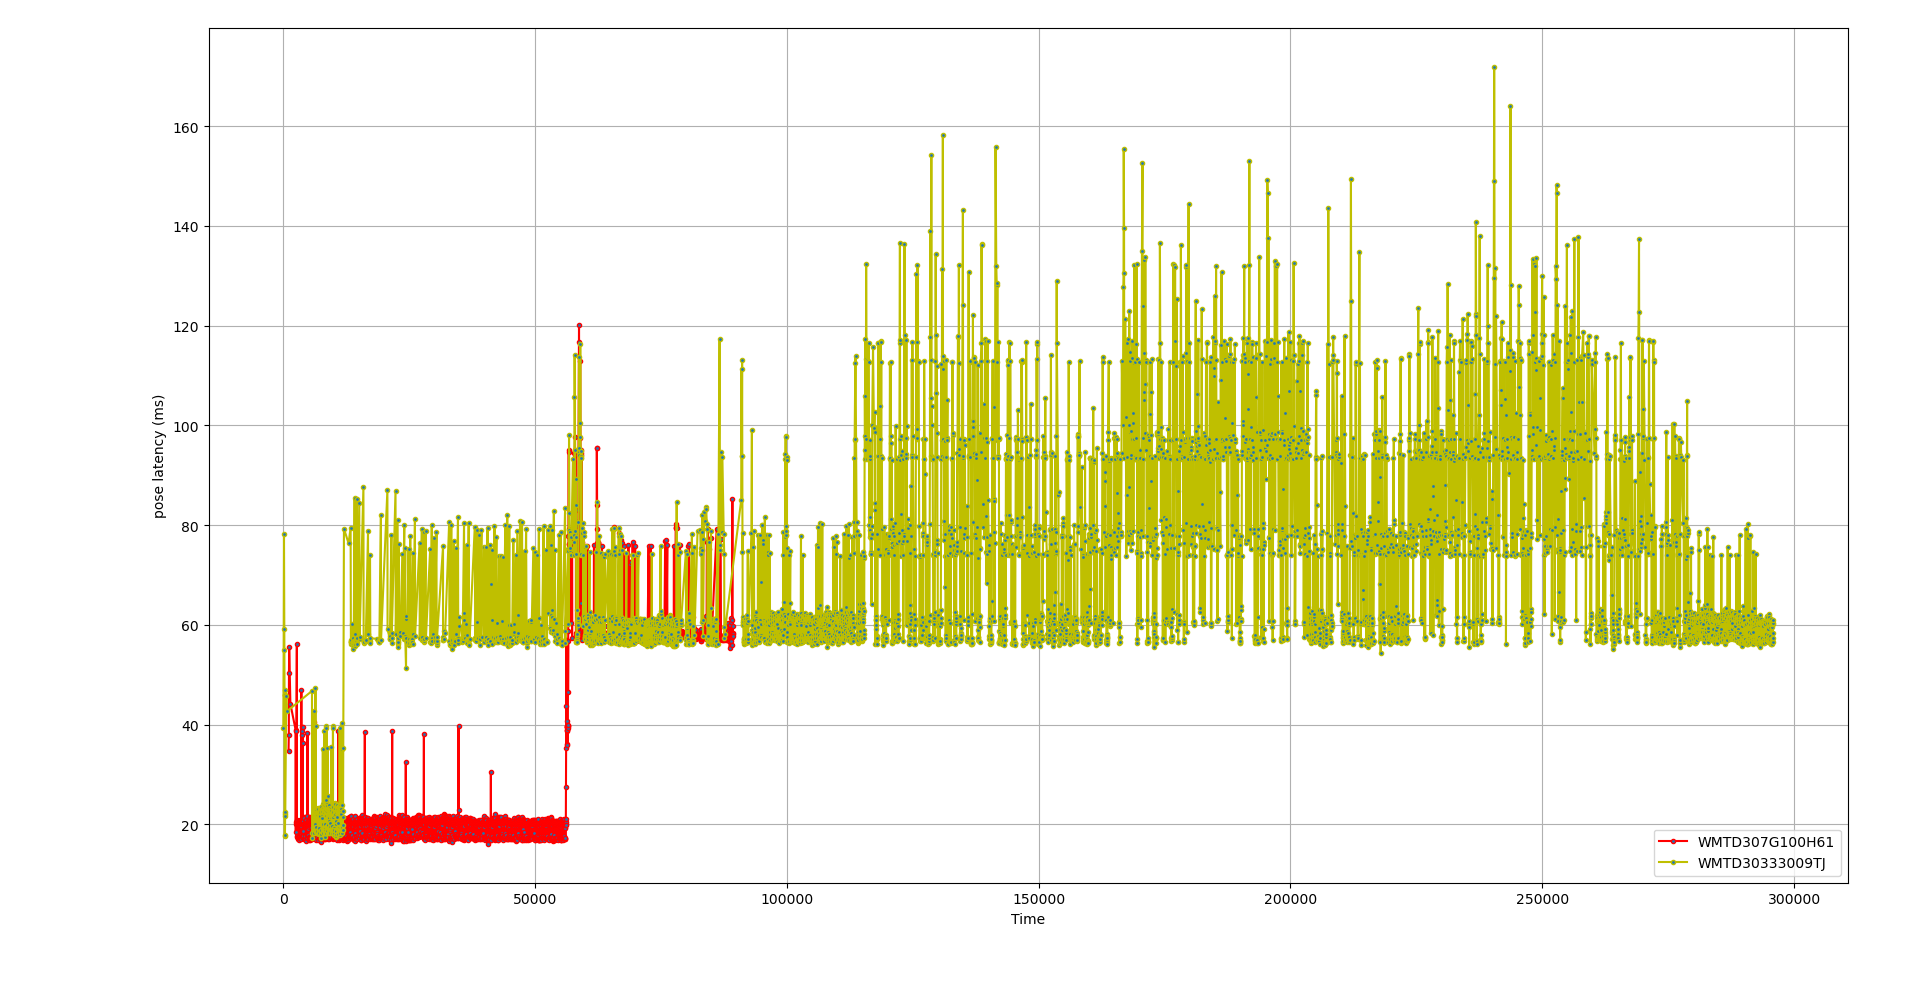

Poses are now being updated up to 40ms earlier and the baseline is consistent with the USB transfer delay.
You can also visibly see the effect of the JPEG decoding support I added over Christmas. The ‘red’ camera is directly connected to USB3, while the ‘khaki’ camera is feeding JPEG frames over USB2 that then need to be decoded, adding a few ms delay.
The latency reduction is nicely visible in the pose graphs, where the ‘drop shadow’ effect of pose updates tailing fusion predictions largely disappears and there are fewer large gaps in the pose observations when long analysis happens (visible as straight lines jumping from point to point in the trace):

